> ## Documentation Index
> Fetch the complete documentation index at: https://docs.juicebox.ai/llms.txt
> Use this file to discover all available pages before exploring further.
# Analytics
Get insights on how your team, projects, agents, and outreach efforts are performing over time.
## Analytics Overview
As a Juicebox Enterprise Admin, you have visibility into how your team is utilizing Juicebox across projects, agents, outreach, and individuals. These analytics can help you understand how to optimize workflows, strengthen collaboration or adoption, and maximize the value of Juicebox.
To make these insights easy to navigate, analytics are exportable for sharing and organized into four core categories:
* **Usage:** Understand team activity and feature adoption
* **Projects:** See your funnel performance by project
* **Outreach:** Track performance across sequences and outreach
* **Agents:** Manage and track activity across your AI Agents
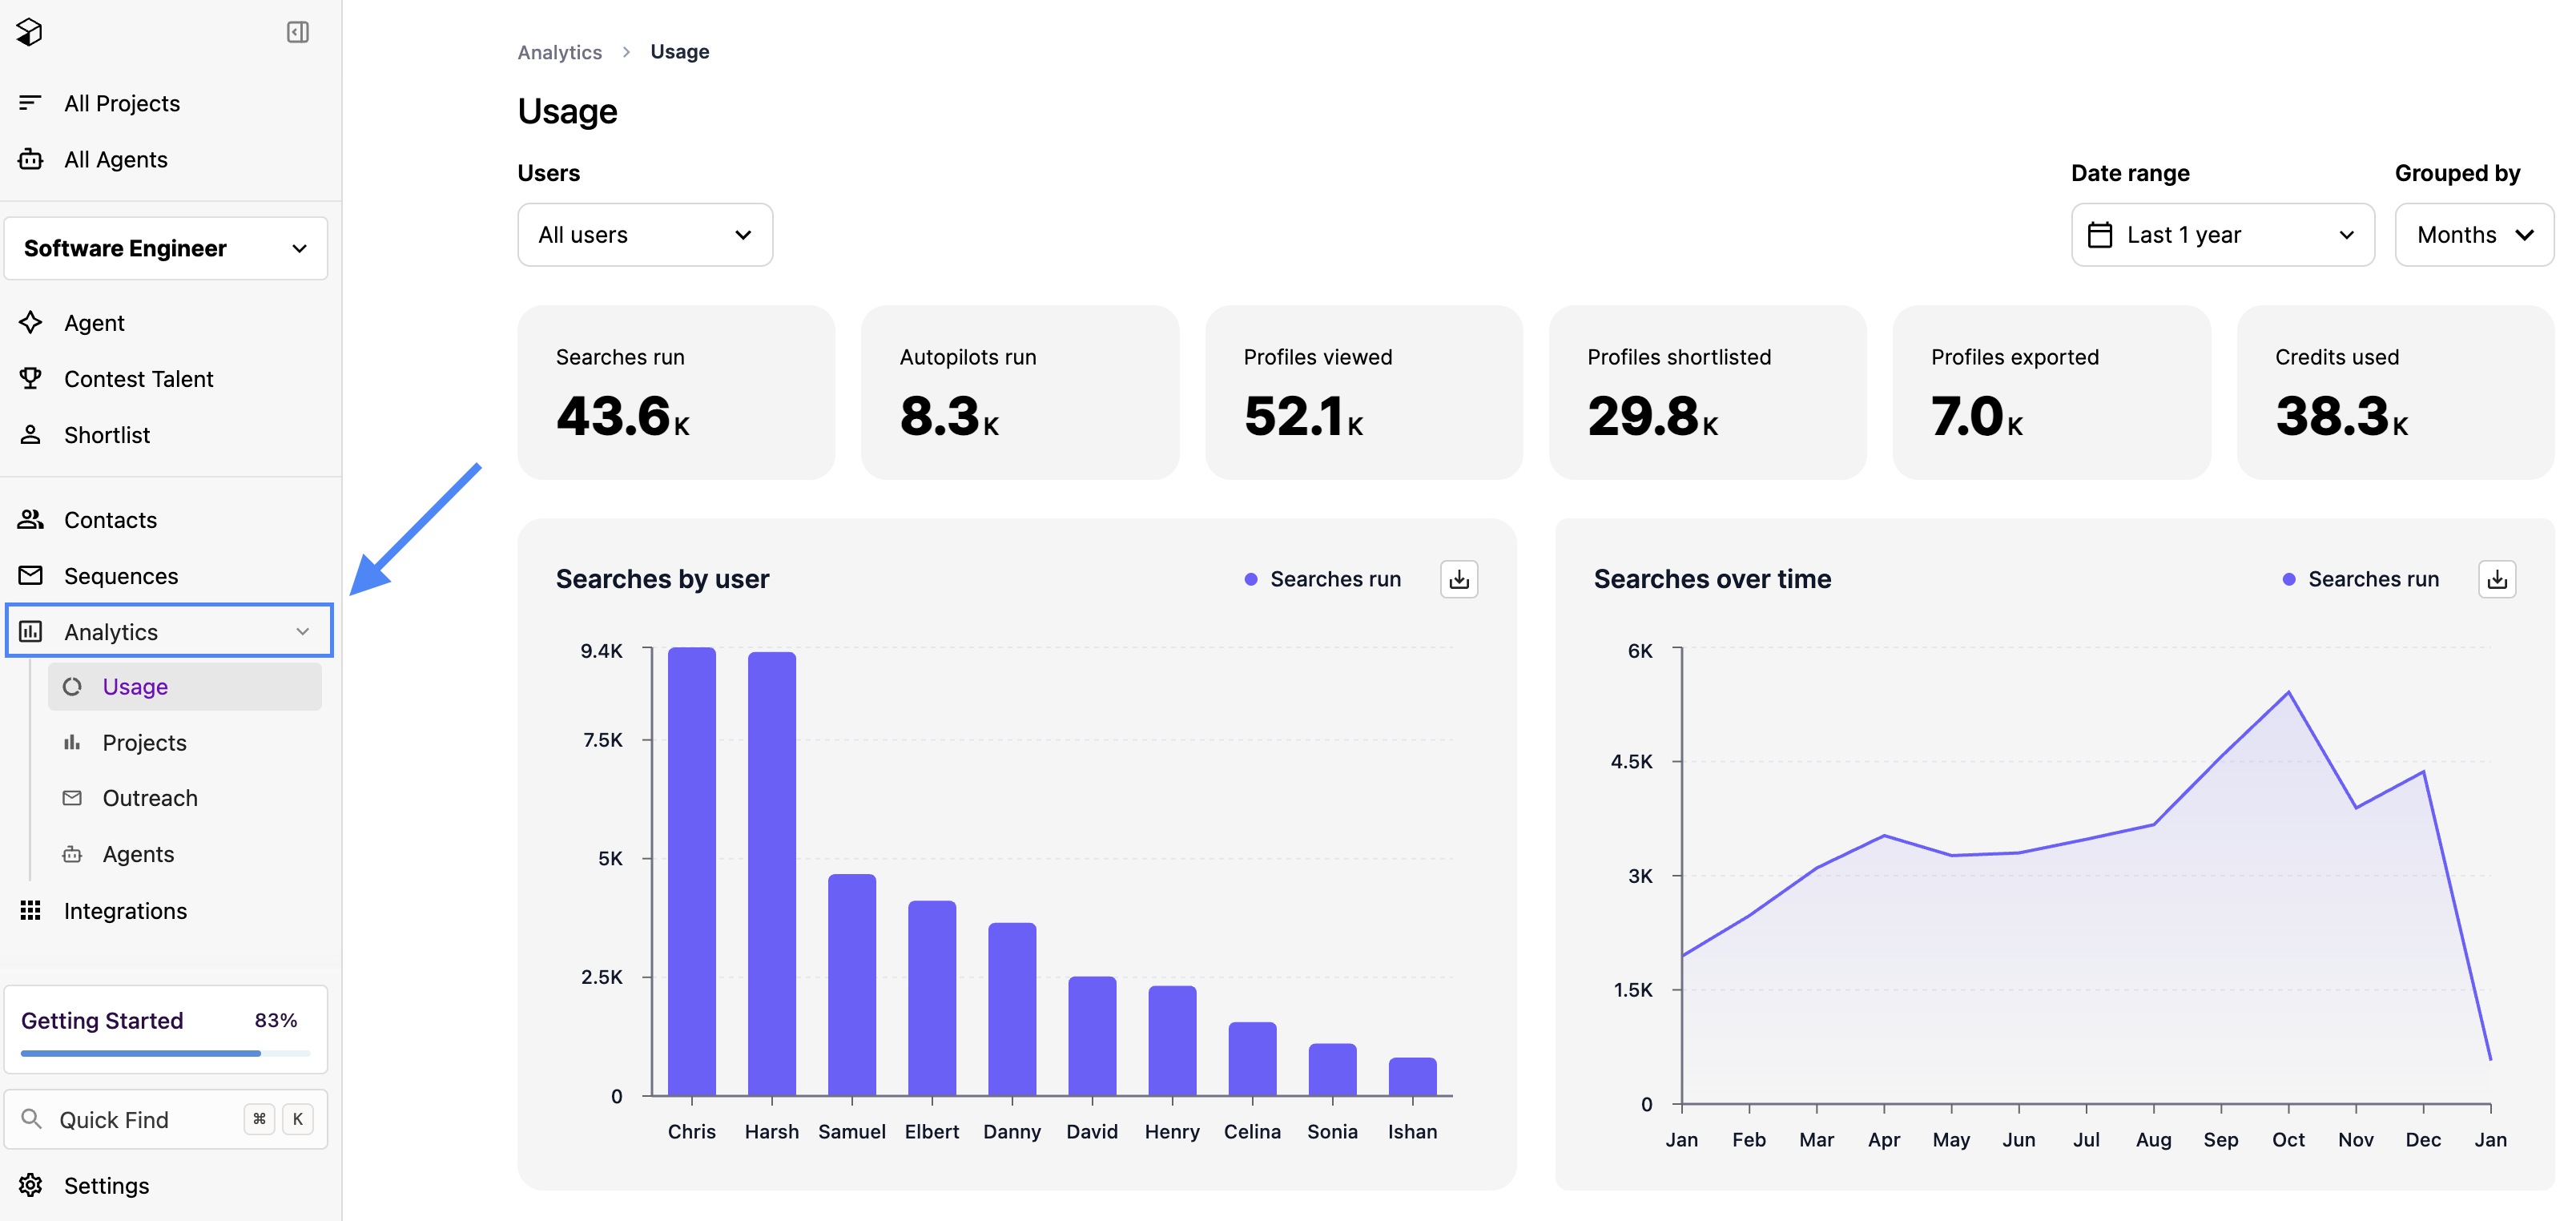
**To understand your analytics, click on one of the drop downs below to learn more.**
### 📊 Usage Analytics
Usage analytics helps admins and team leads understand where value is being generated by breaking out metrics on how the platform is being used over time and by whom.
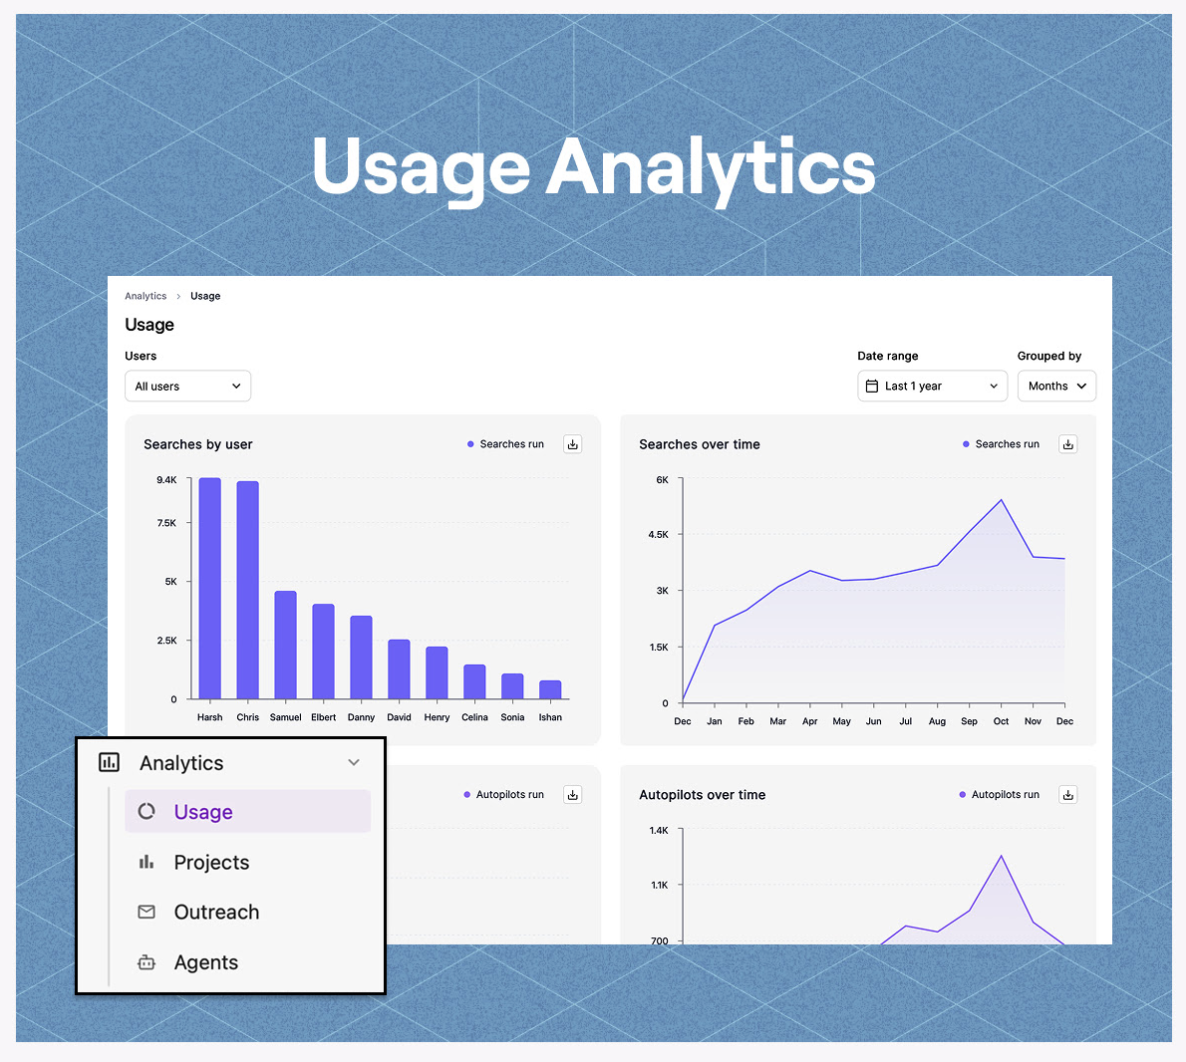
**This view is designed to answer questions like:**
* Who is actively sourcing in Juicebox?
* Which features are driving the most usage (search, autopilots, exports)?
* How are credits being consumed across the team?
* Are there opportunities for enablement or optimization?
**With key metrics including:**
* **Searches run:** Total number of searches created
* **Autopilots run:** Total number of autopilots ran
* **Profiles viewed:** Total number of individual profiles reviewed
* **Profiles shortlisted:** Total number of profiles saved / qualified across projects for further engagement or sharing
* **Profiles exported:** Total number of profiles exported back to your ATS and/or downloaded via a CSV
* **Credits used:** Total number of contact credits used
**For a more granular breakdown, filter usage analytics by:**
* User
* Date range
* Time period (e.g., days, weeks, months)
### 📈 Projects Analytics
Project analytics provides visibility into recruiting performance at the project level. This view helps you understand how each project is progressing or where efforts may need to be prioritized.
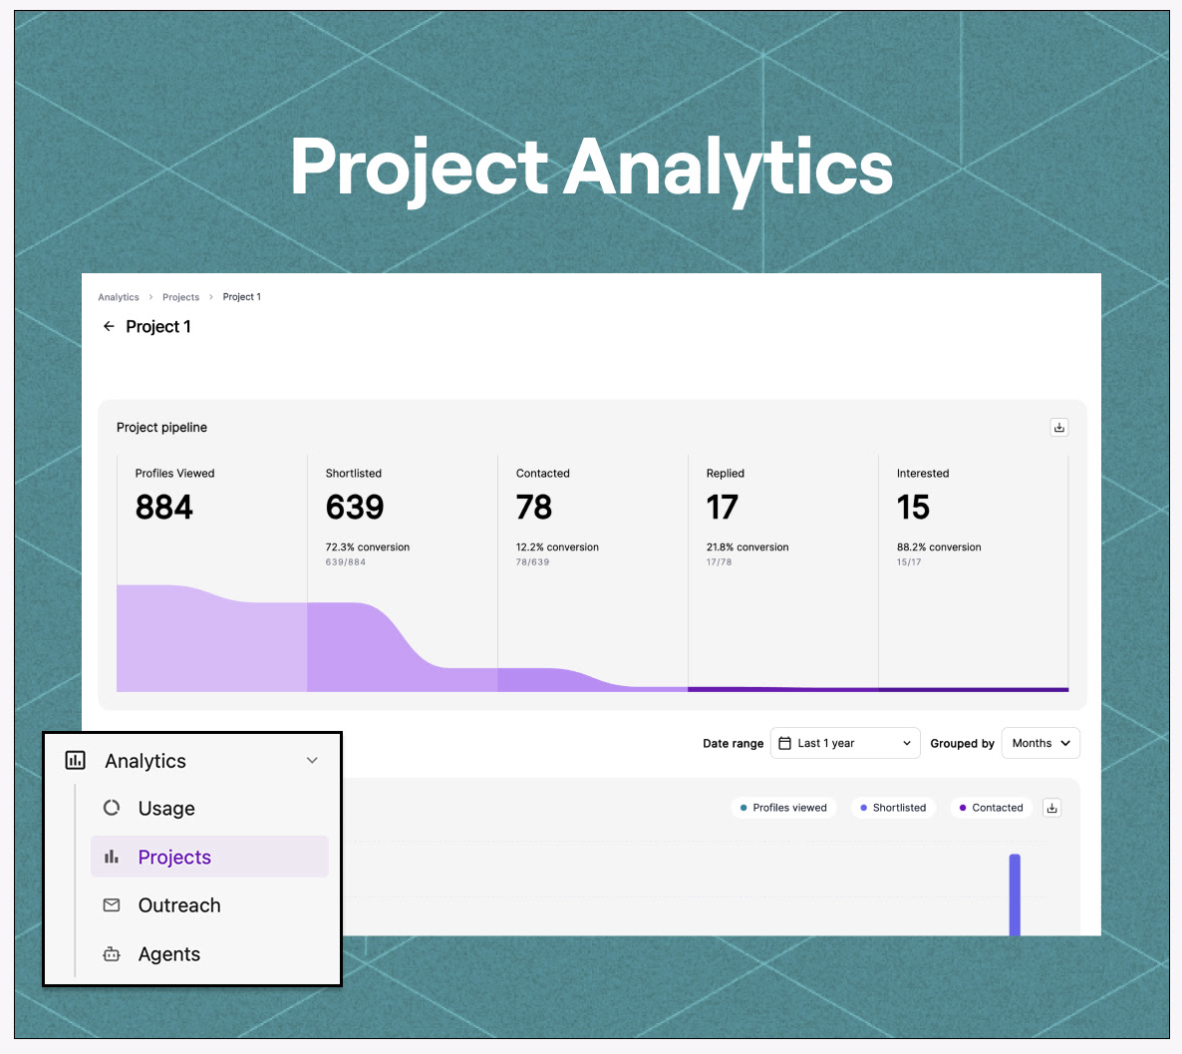
**This view is designed to answer questions like:**
* How many projects have been created in Juicebox?
* How many candidates have been shortlisted for each project?
* How quickly are candidates being contacted?
* How is a specific project performing, and where should efforts be prioritized?
* Which projects is a particular user actively working on?
**With key metrics including:**
* **Total projects:** Total number of projects created
* **Shortlisted:** Total number of candidates shortlisted
* **Contacted:** Total number of candidates contacted
* **Average time to contact:** How long it takes to contact a candidate
* **Replies:** Total number of candidate replies
* **Interests:** Total number of interested candidate replies
**For a more granular breakdown, filter project analytics by:**
* Project
* User
* Date range
### 💌 Outreach Analytics
Outreach analytics helps you measure and optimize the performance of your email sequences and outreach efforts. These insights show how candidates engage with your messaging, where drop-off occurs, and how consistently your team is engaging with talent.
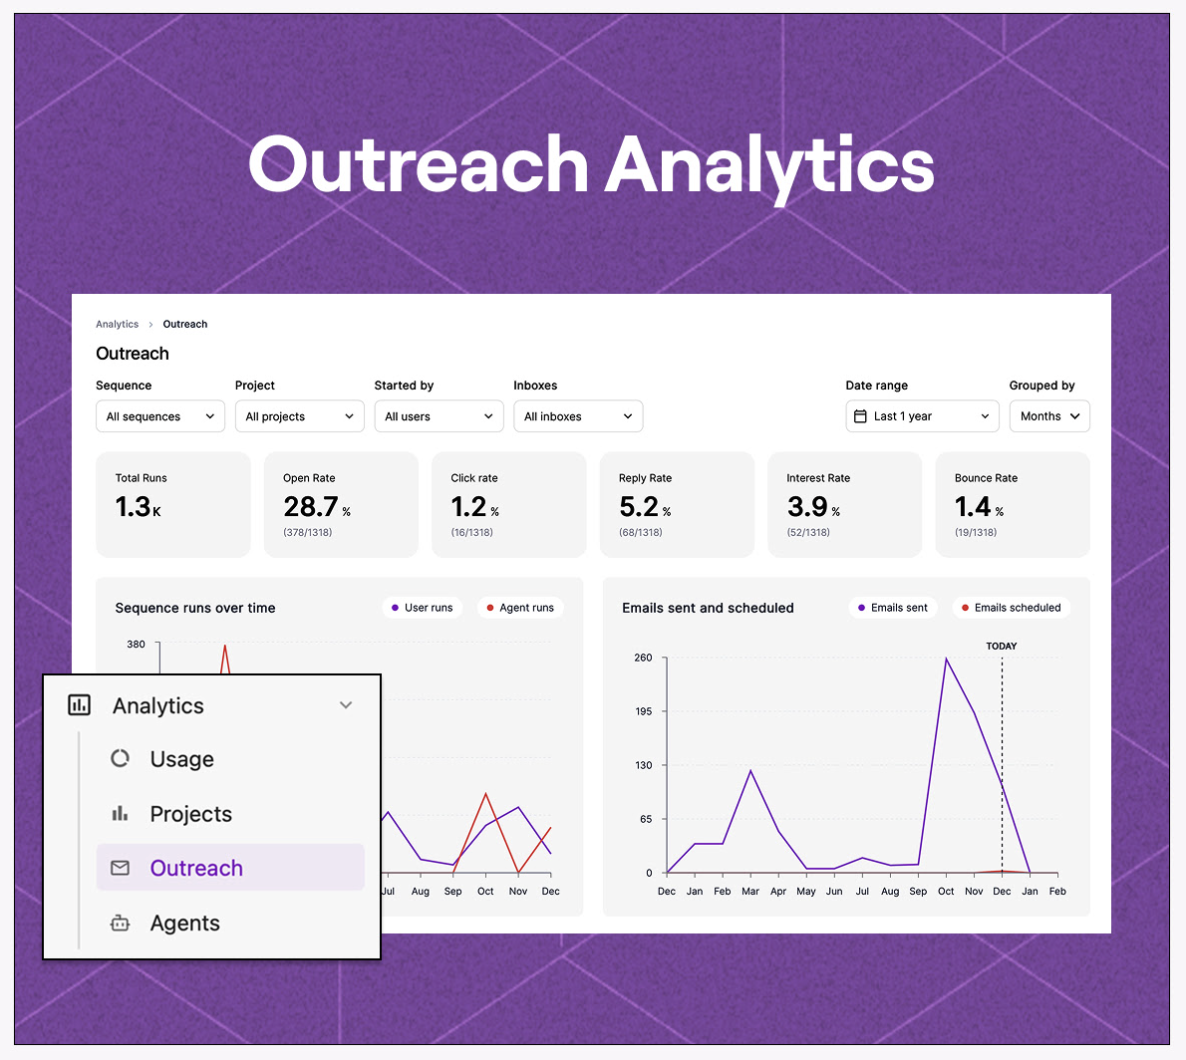
**This view is designed to answer questions like:**
* Are my email sequences performing well overall, or only within certain projects?
* Where are candidates disengaging?
* Which messages or sequences need to be updated or tested?
* Is my team generating enough interested candidate responses across projects?
**With key metrics including:**
* **Total runs:** Total number of sequences sent out over time
* **Open rate:** Percentage of sequences opened by candidates
* **Click rate:** Percentage of sequence links clicked by candidates
* **Reply rate:** Percentage of emails replied to by candidates
* **Interest rate:** Percentage of candidate replies that were interested in your project / opportunity
* **Bounce rate:** Percentage of sequences that were undeliverable
**For a more granular breakdown, filter outreach analytics by:**
* Sequence
* Project
* Started by
* Inboxes
* Date range
* Time period (days, weeks, months)
View our [Optimizing Response Rates](/maximize-replies) article to learn how to enhance outreach efforts and reply rates
### 🤖 Agent Analytics
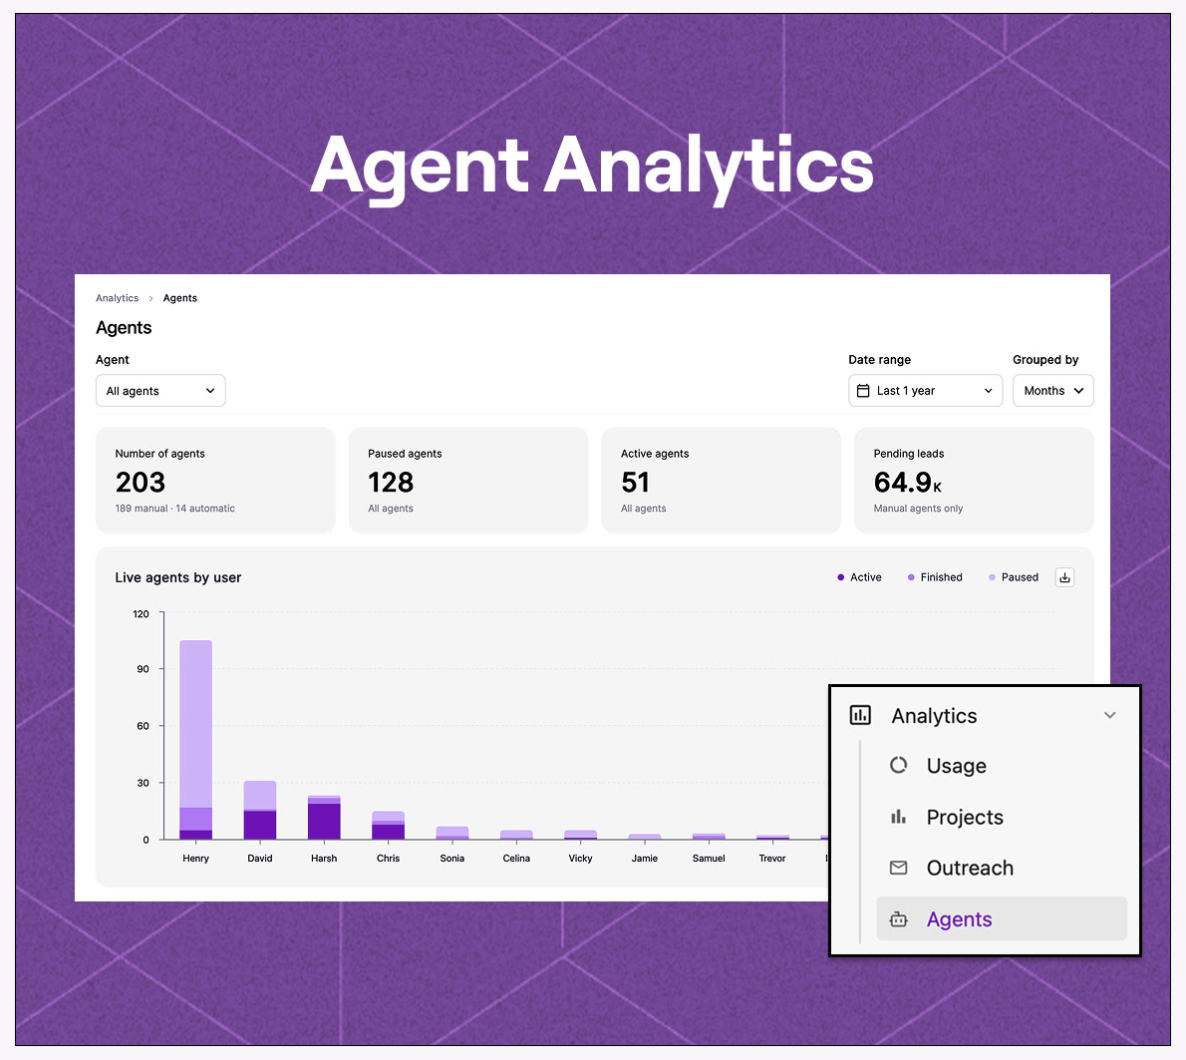
Agent analytics give you visibility into agent-led sourcing and outreach as you scale your hiring efforts. This view helps you ensure automation is driving results while maintaining control over candidate quality, approvals, and outcomes.
By monitoring how agents source, qualify, and surface leads, you can confidently scale automation, fine-tune agent configurations, and identify opportunities to improve efficiency without sacrificing relevance.
**This view is designed to answer questions like:**
* How effective are my agents at finding relevant candidates?
* What is my approval rate across agents, and how does it trend over time?
* How many interested candidates are agents generating?
* Are agents correctly configured based on approved vs. disapproved leads?
* How many leads are pending approval or still awaiting action?
**With key metrics including:**
* **Leads approved:** Total number of agent sourced candidates approved
* **Leads disapproved:** Total number of agent sourced candidates rejected
* **Approval rate:** Percentage of all agent sourced candidates approved
* **Interested replies:** Total number of agent sourced candidates who replied that they are interested
* **Number of agents:** Total number of agents created
* **Paused agents:** Total number of paused agents
* **Active agents:** Total number of active agents
* **Pending leads:** Total number of candidate reviews outstanding
**For a more granular breakdown, filter agent analytics by:**
* Agent
* Date range
* Time period (days, weeks, months)
### **Sharing Analytics**
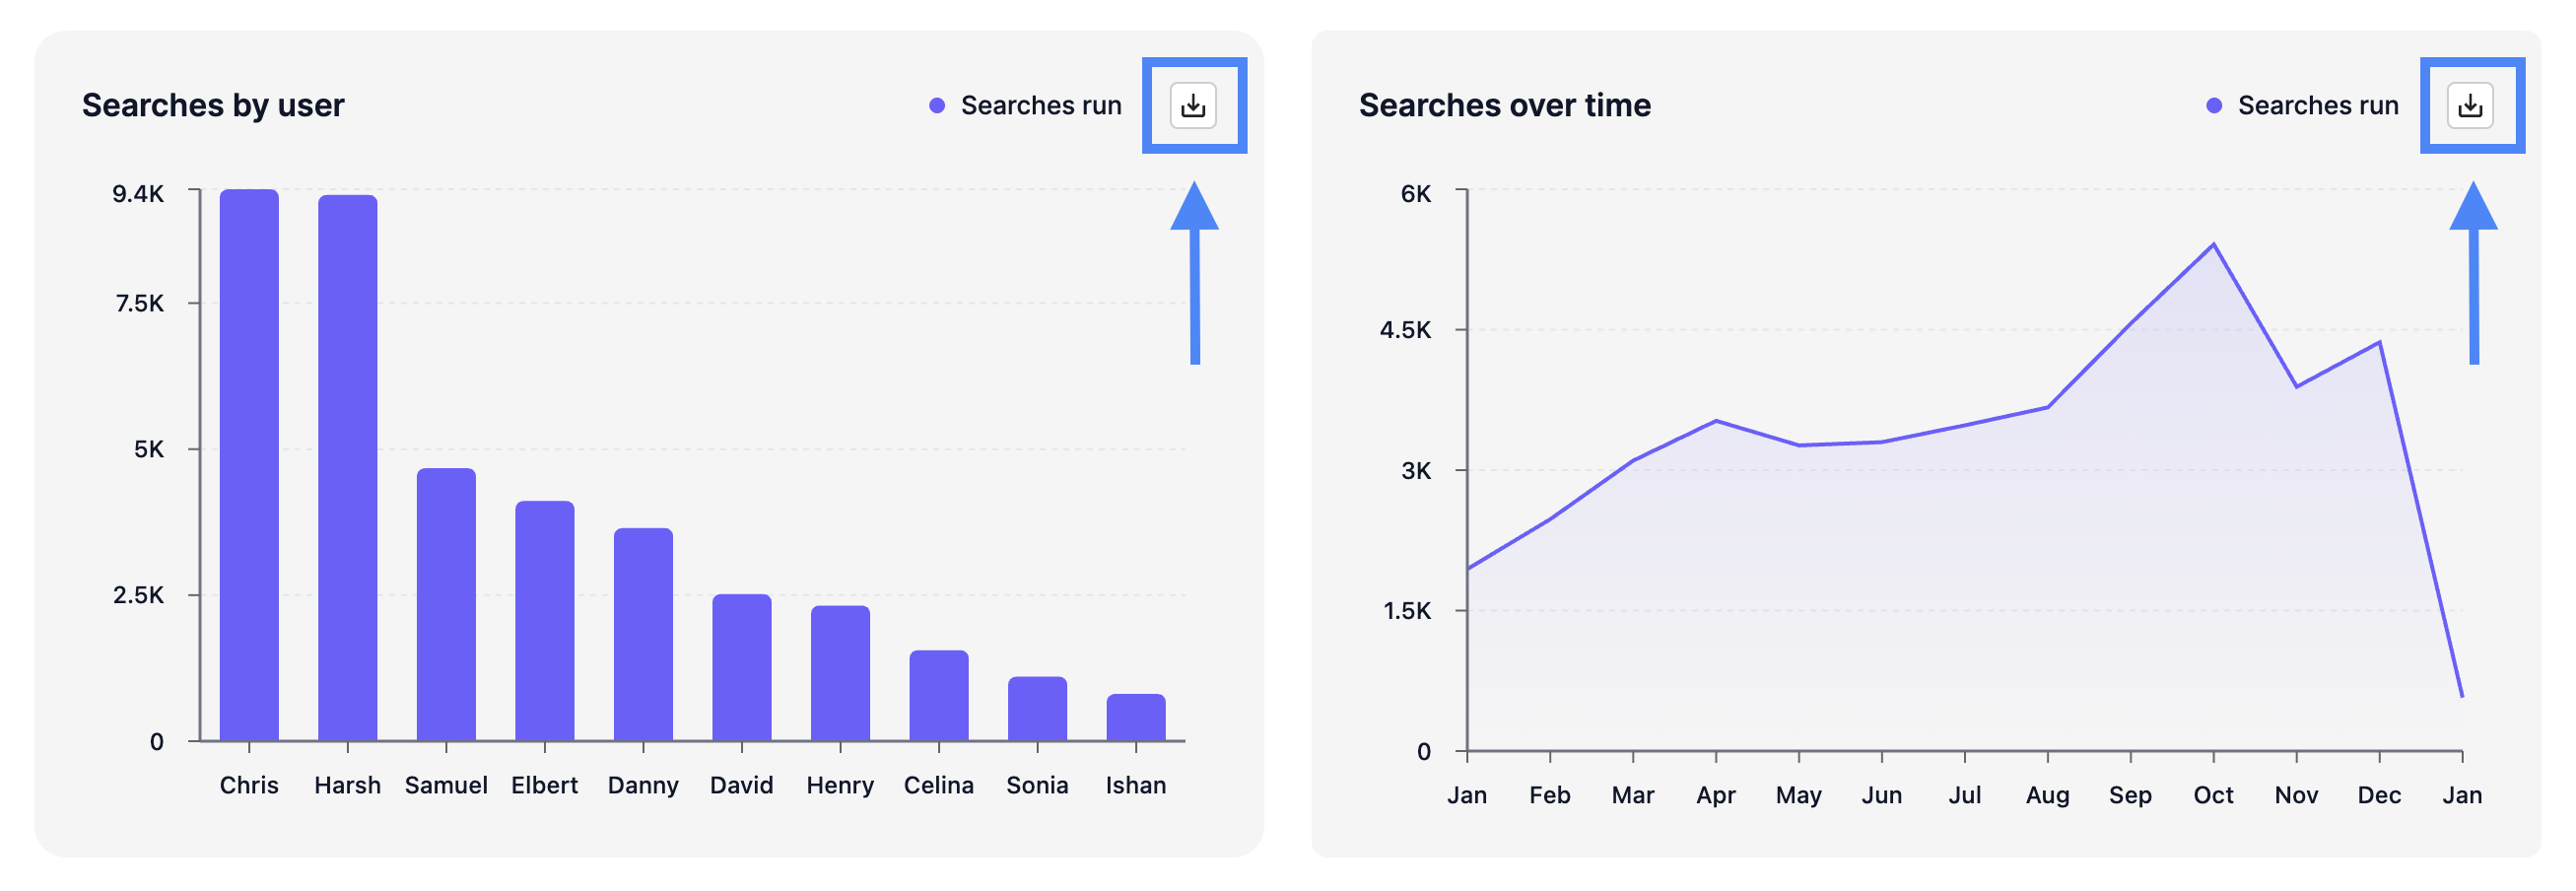
To share or export your analytics, please select the arrow icon in the top right hand corner of the corresponding metric.
### **Access Analytics**
Analytics are included on the Enterprise plan in an admin-only configuration. Upon request, usage analytics can be added to Team plans. Please reach out to our sales team at [sales@juicebox.work](mailto:sales@juicebox.work) or your CSM for more details.