

Insights Overview
Insights provide a data-driven view of your talent pool, helping recruiters understand, refine, and optimize their search strategy. It aggregates the data from your search results to surface patterns in experience, skills, geography, and career backgrounds to help turn that raw candidate list into actionable intelligence.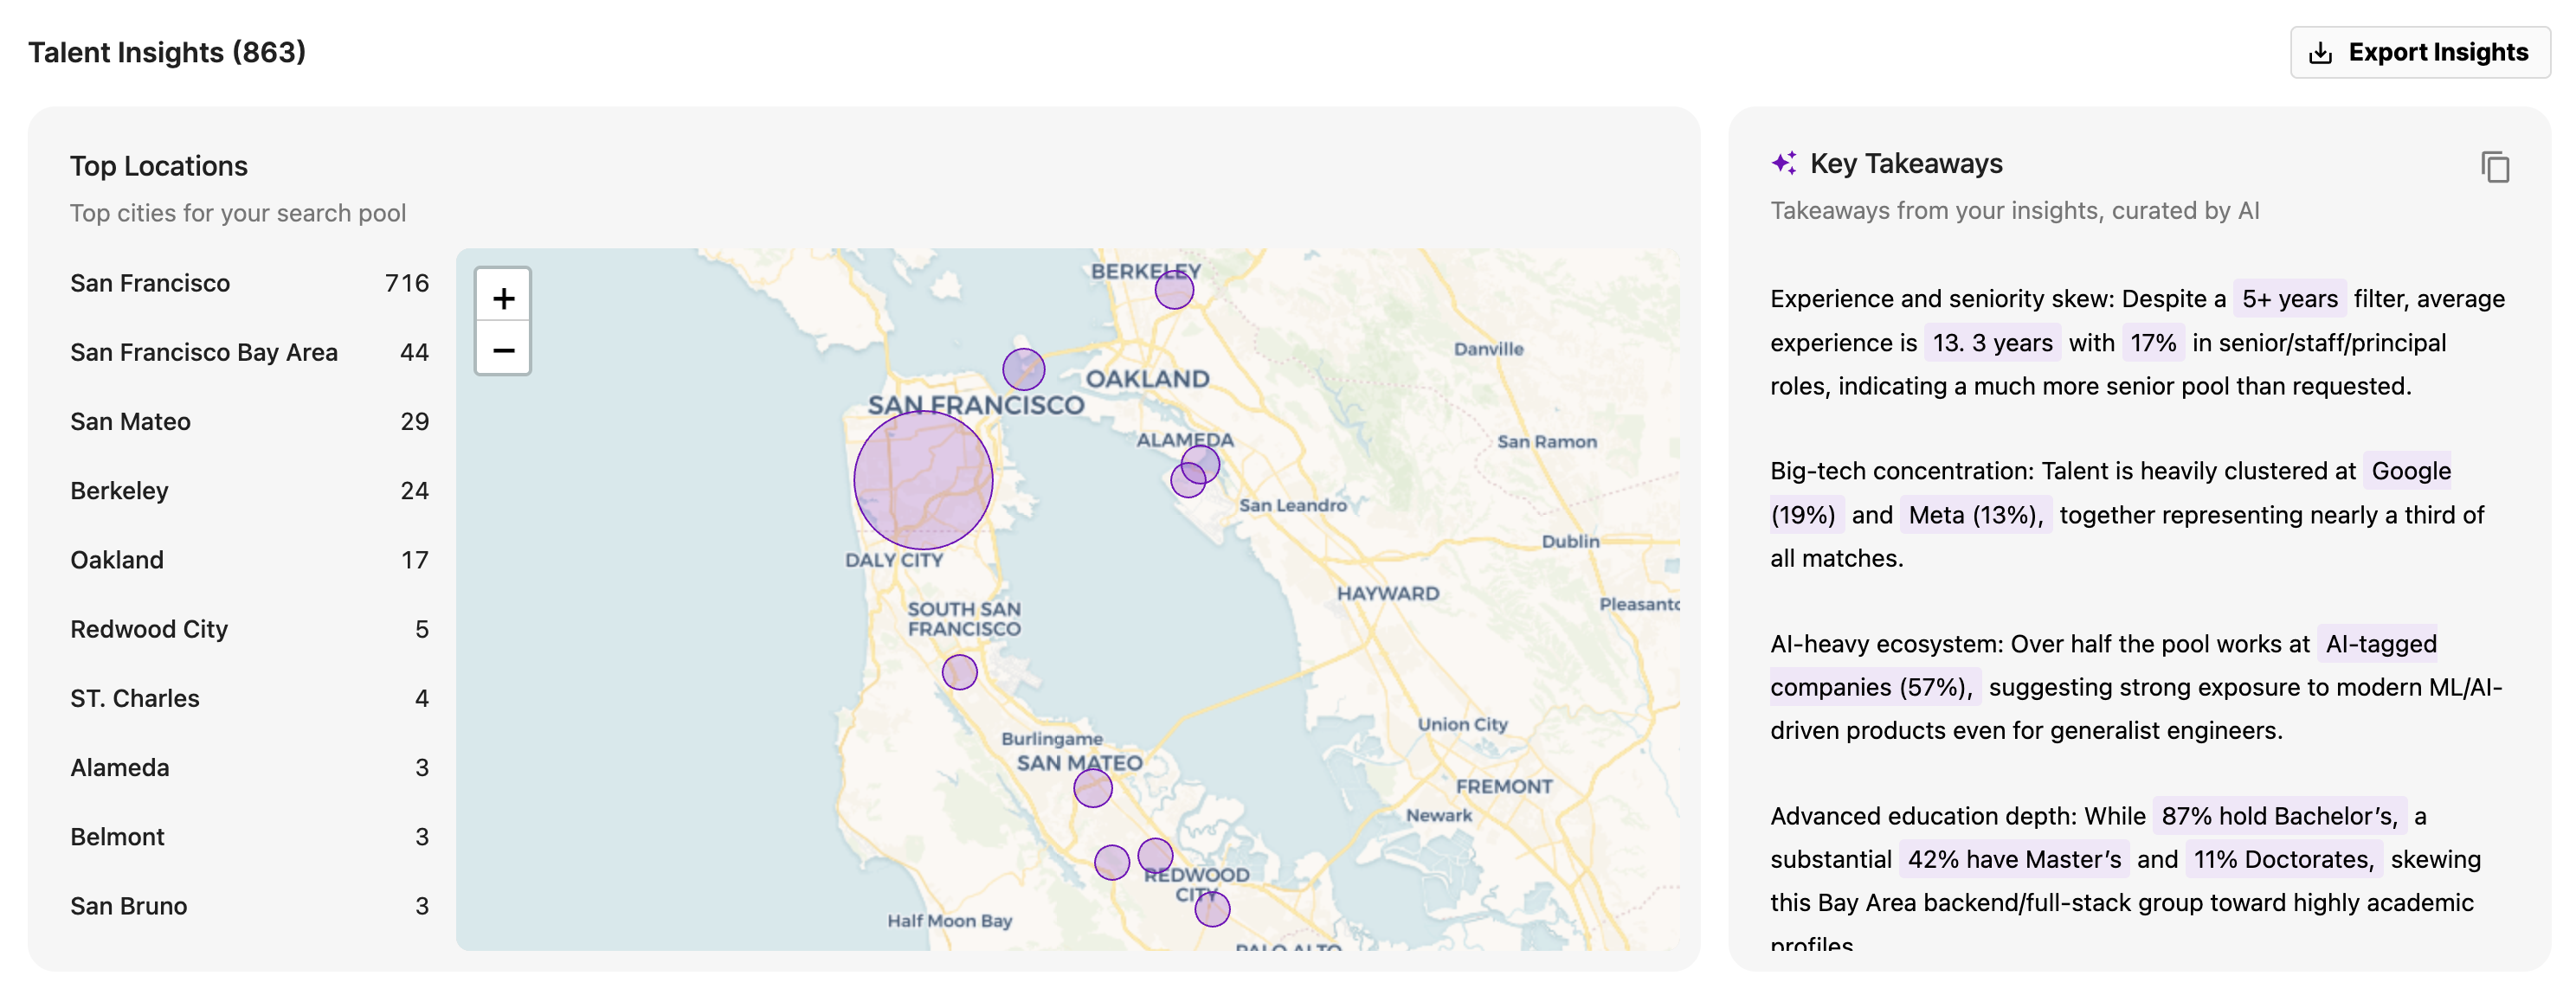
Use Cases
Rather than reviewing profiles one by one, Insights enable teams to evaluate the entire talent market at a glance to make more informed hiring decisions. From this report, you can:- Define your recruiting strategy by identifying target companies, talent locations, and realistic hiring criteria before sourcing begins.
- Refine your search by focusing directly on the talent who have a specific skill, job title, major, etc.
- Identify market dynamics to understand talent availability by location, skill, or employer.
Navigating to Insights
All Insights reports are interactive and tied to an individual search. To view a report, open your project’s search and select Insights from the top navigation bar. For a detailed breakdown of the data included, please see the full report below, organized from the top of the Insights report to bottom.
Top Locations and Key Takeaways
Identify your talent’s top locations or geographic hotspots.- Top Locations: On the left, you will see the geographical distribution of your talent pool. It will automatically adjust to the geography your talent is located in, showing you up to 10 of the most popular cities. The locations and map are both interactive, in case there is a specific city you want to narrow in on.
- Key Takeaways: On the right, the key takeaways will provide you an aggregated overview of your talent pool, including some stats and highlights from each section. These takeaways can be copied or selected to automatically bring you to the relevant chart.
Years of Experience and Tenure
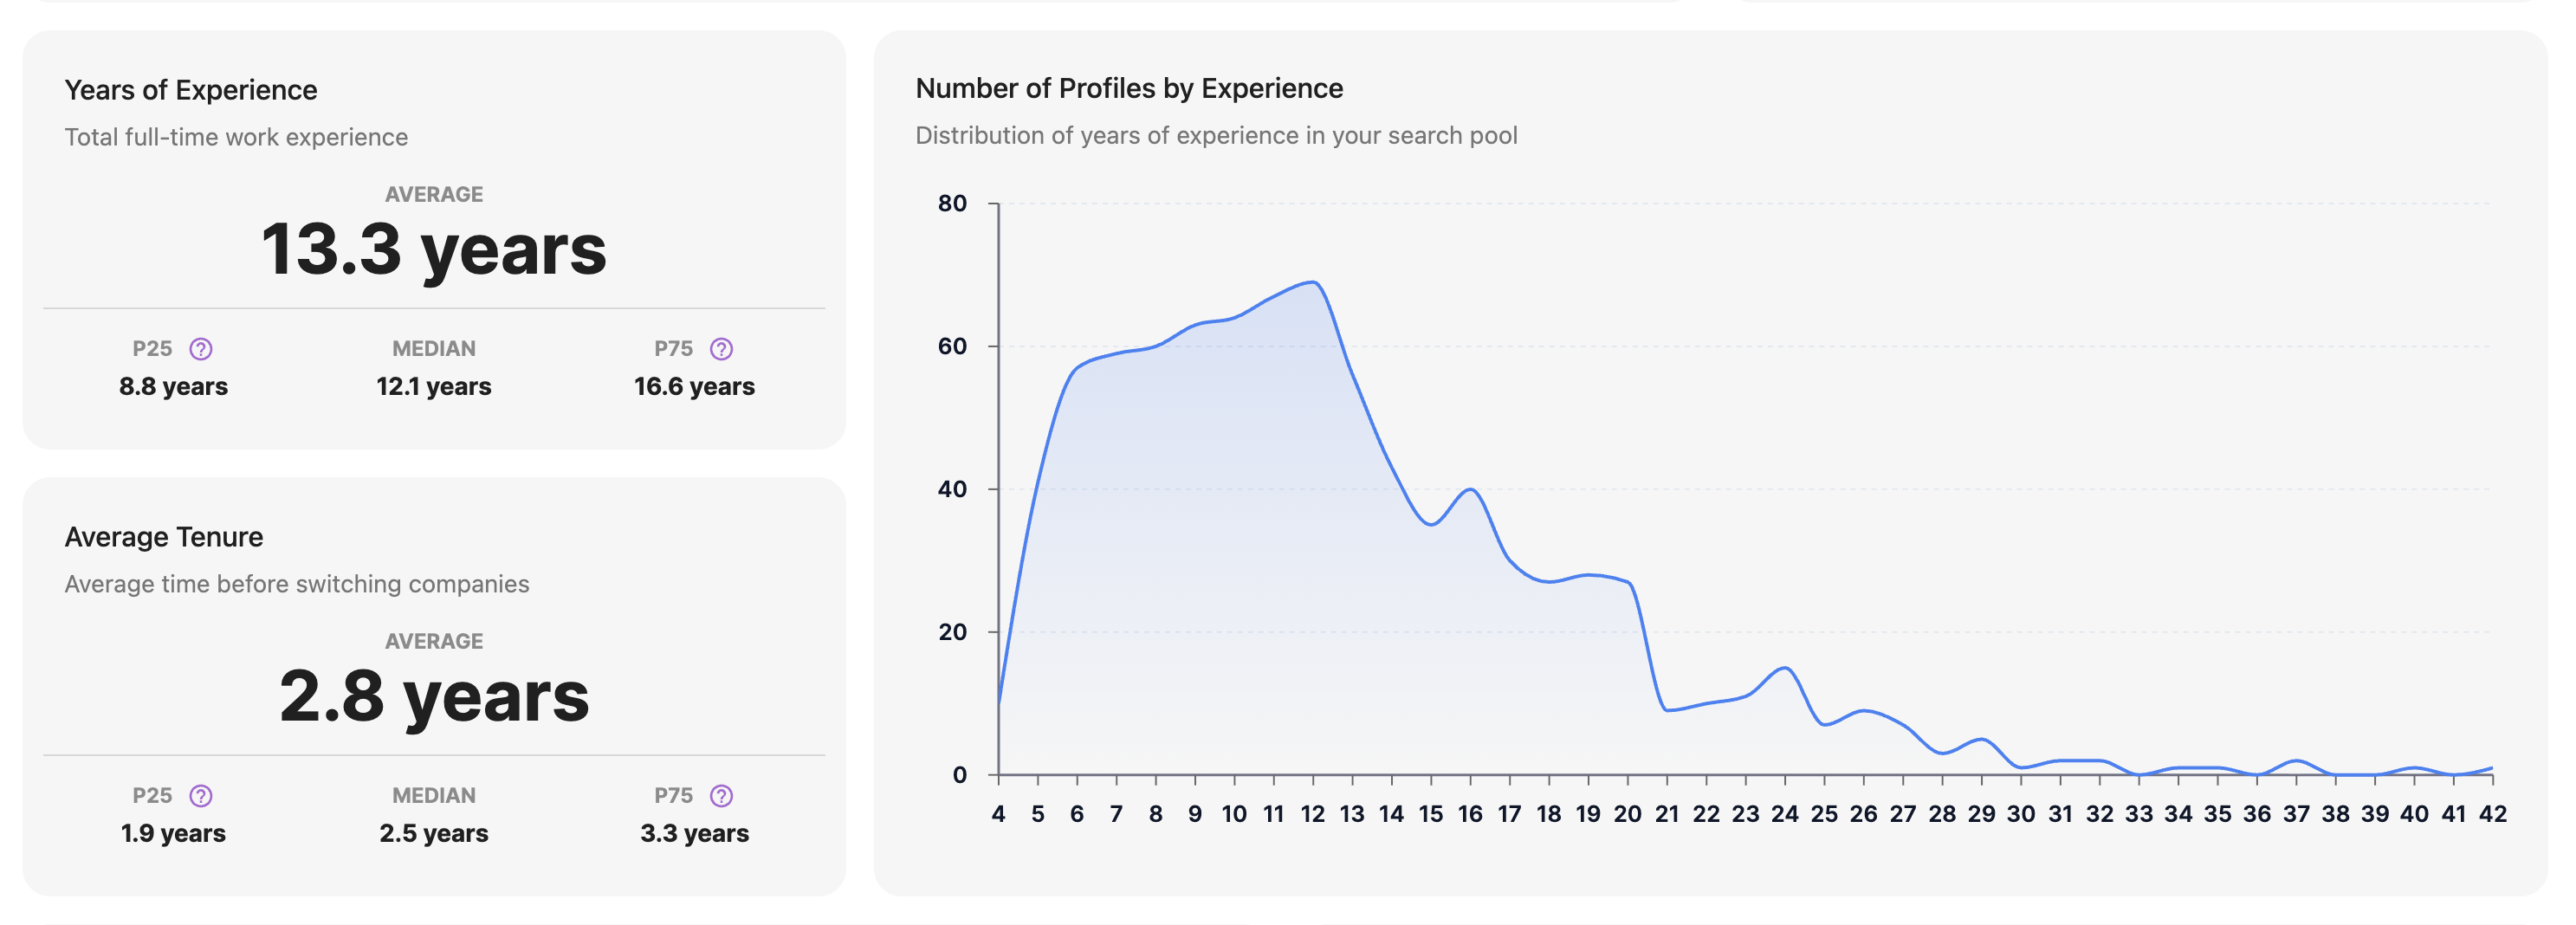
See the average tenure of your talent, plus their overall years of experience.- Years of Experience [Values]: Analyze the average, median, and percentile distribution of your talent pool’s overall years of experience. To dive deeper into P25/P75 values, please see the info box below.
- Years of Experience [Graph]: Visually analyze the years of experience distribution across your talent pool. Years of experience is calculated as years of full-time work experience, and does not include internships.
- Average Tenure: The average tenure of a profile represents how long they stay at a company before moving to a new company.
Skills, Employers, and Job Titles
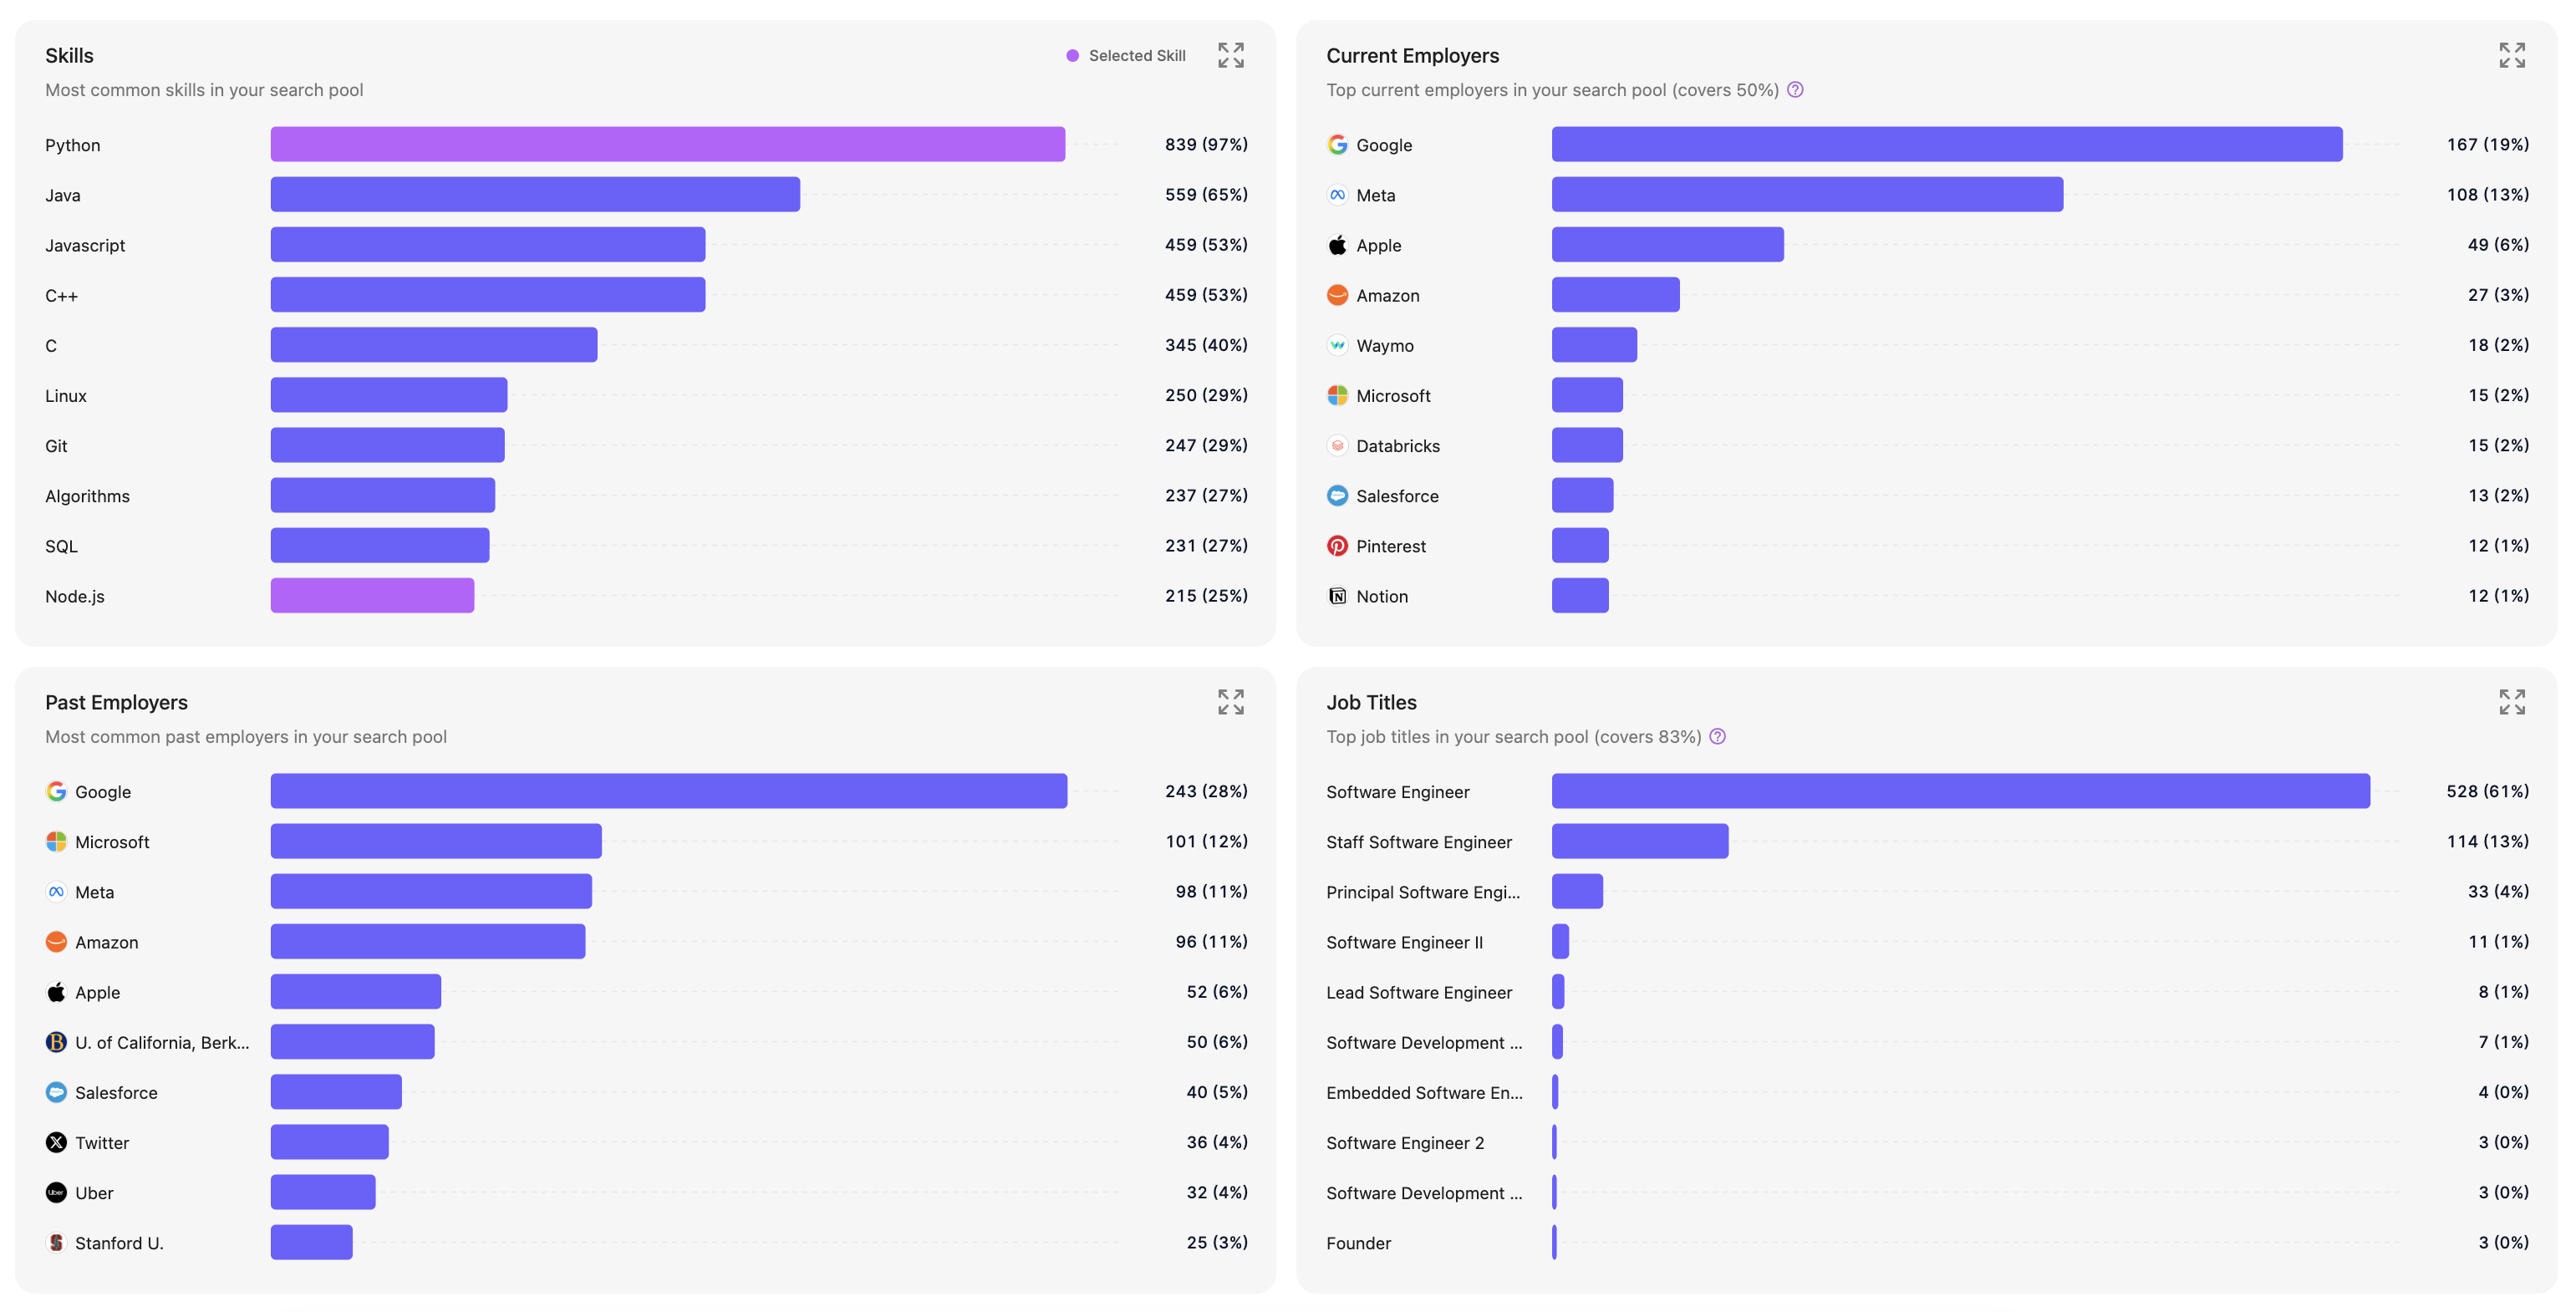
Dive deeper into the employment background and skills of your talent pool.- Skills: The most frequently occurring skills across your talent pool. If you have any skills selected or pinned in your search, they will appear in light purple. Skills selected in the search will always be shown as part of the graph.
- Current Employers: The current employers of your talent pool. Please note, this graph may be hidden if there is only one employer identified in your talent pool.
- Past Employers: The top companies where your talent has previously worked at some point in their career.
- Job Titles: The top job titles currently held by your talent pool.
Job Title Levels and Roles, Gender Distribution and Industries
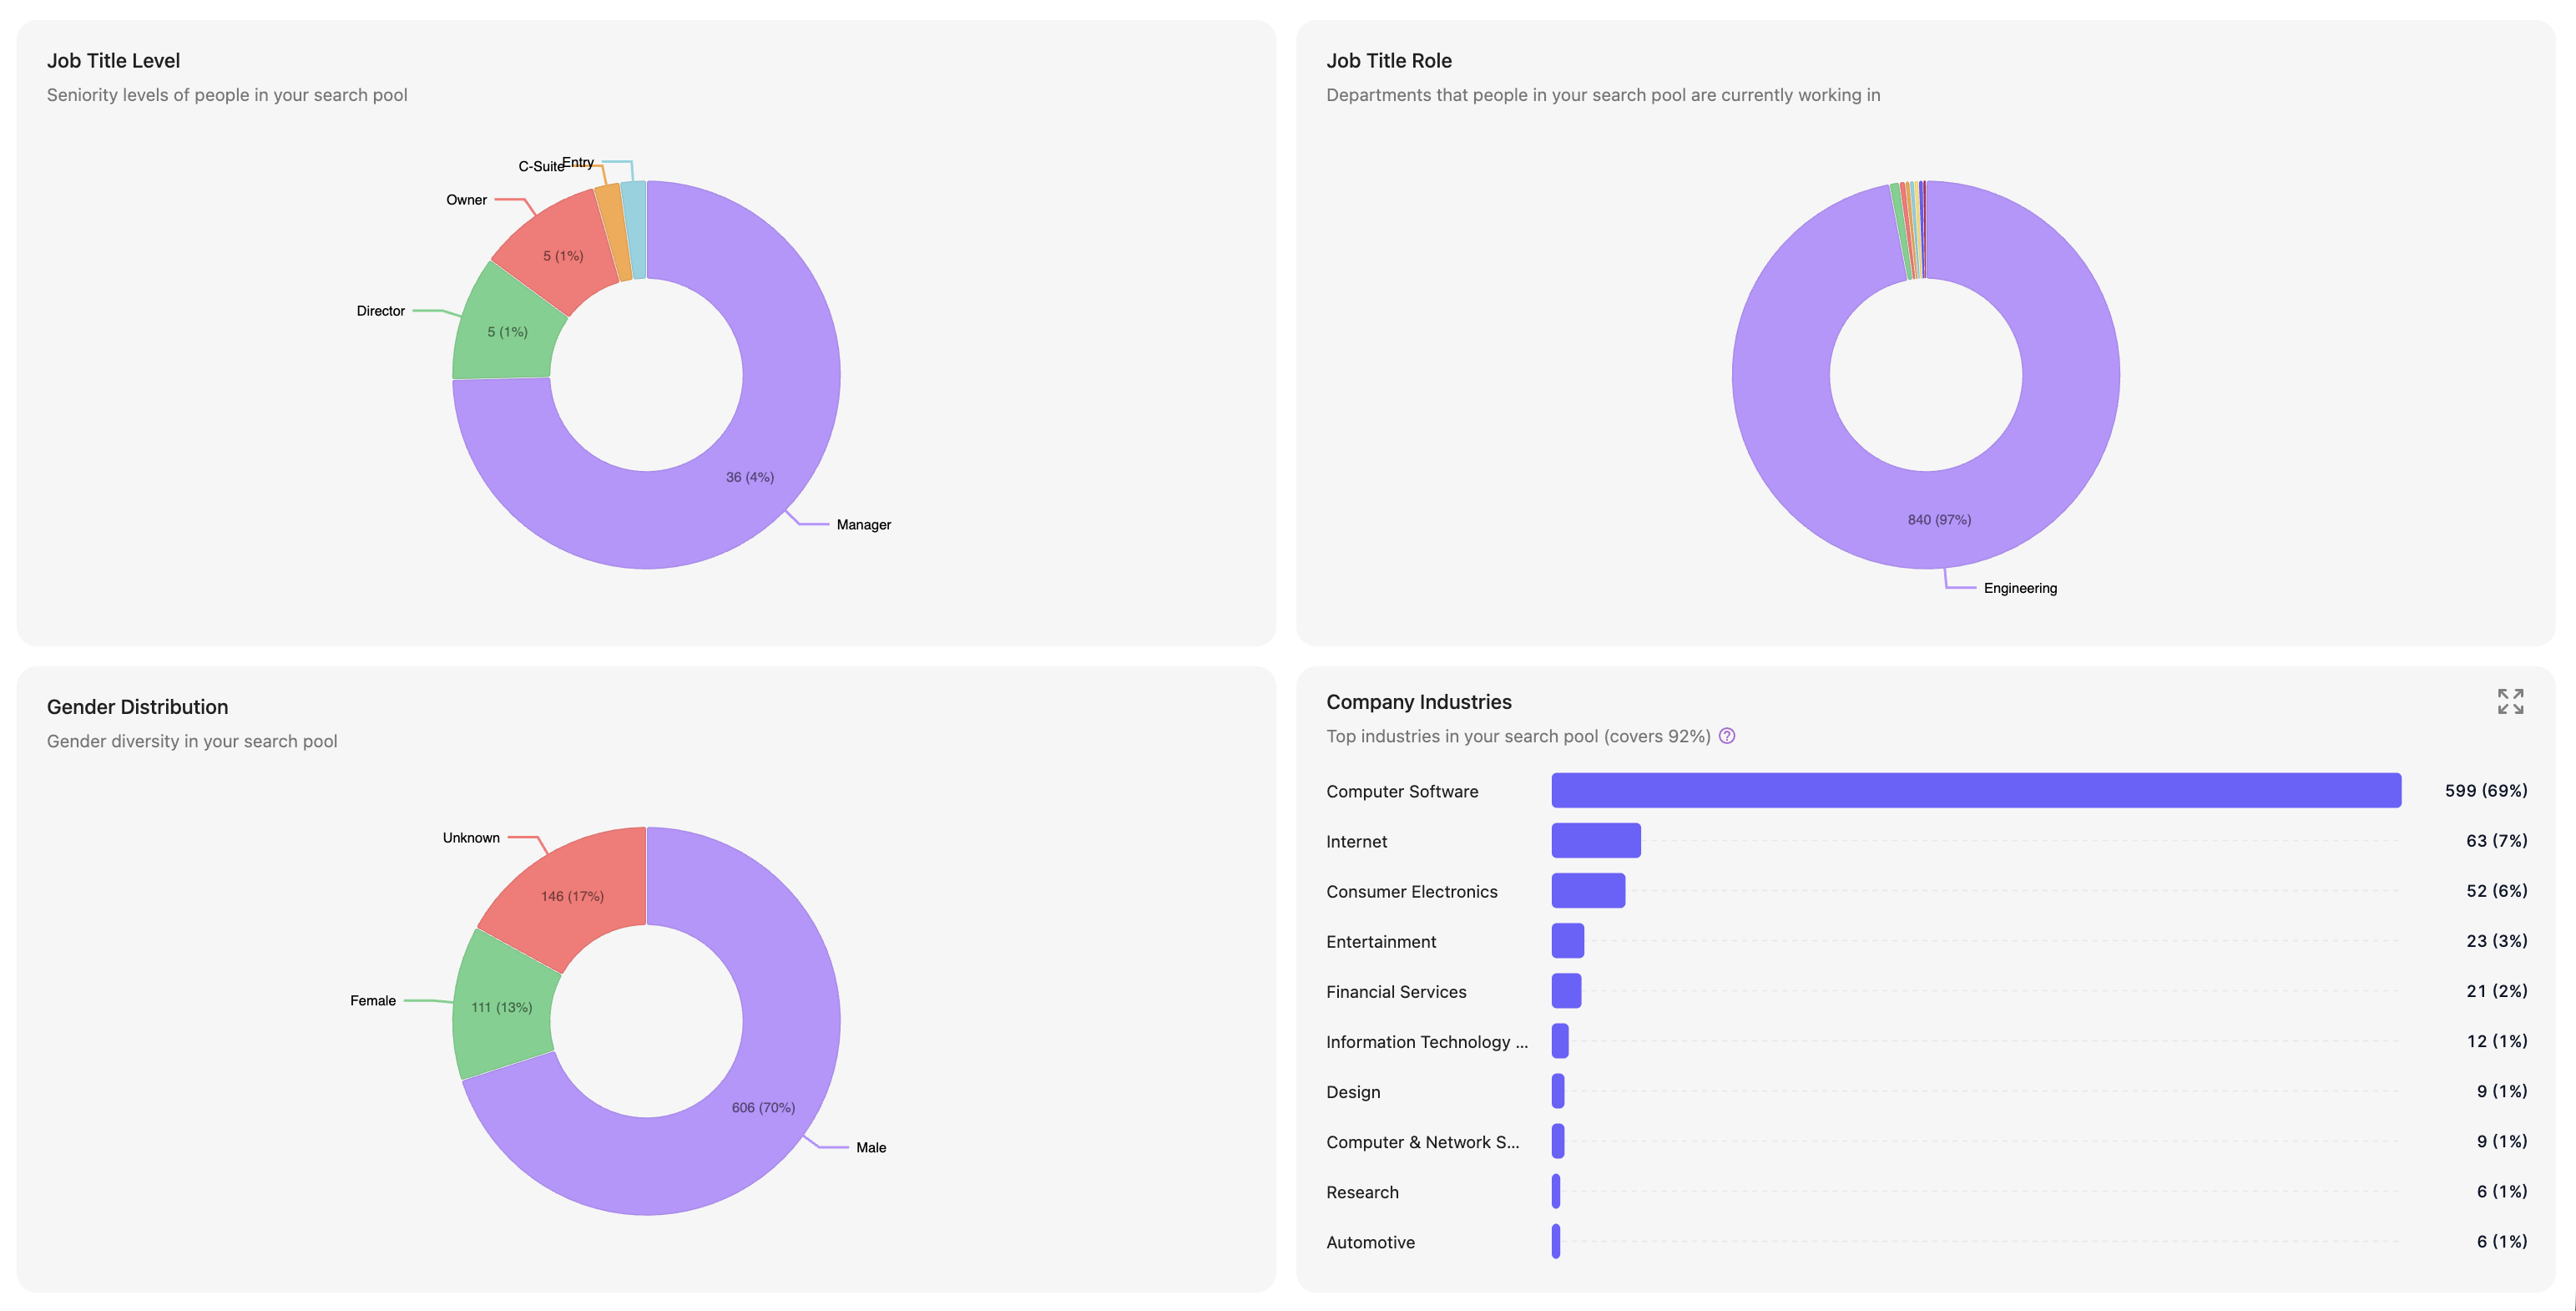
Determine the top industries, departments and levels of your talent pool.- Job Title Level: A breakdown of the seniority levels of your talent pool.
- Job Title Role: The departments that your talent currently works in, e.g. Engineering or Marketing.
- Gender Distribution: The gender diversity breakdown of your talent pool.
- Company Industries: The top industries your talent currently works in. Please note, these are based on the companies the individuals work in, so someone working at Bank of America would be classified as working in the Banking industry.
Company Type, Funding Stages, Tags and Universities
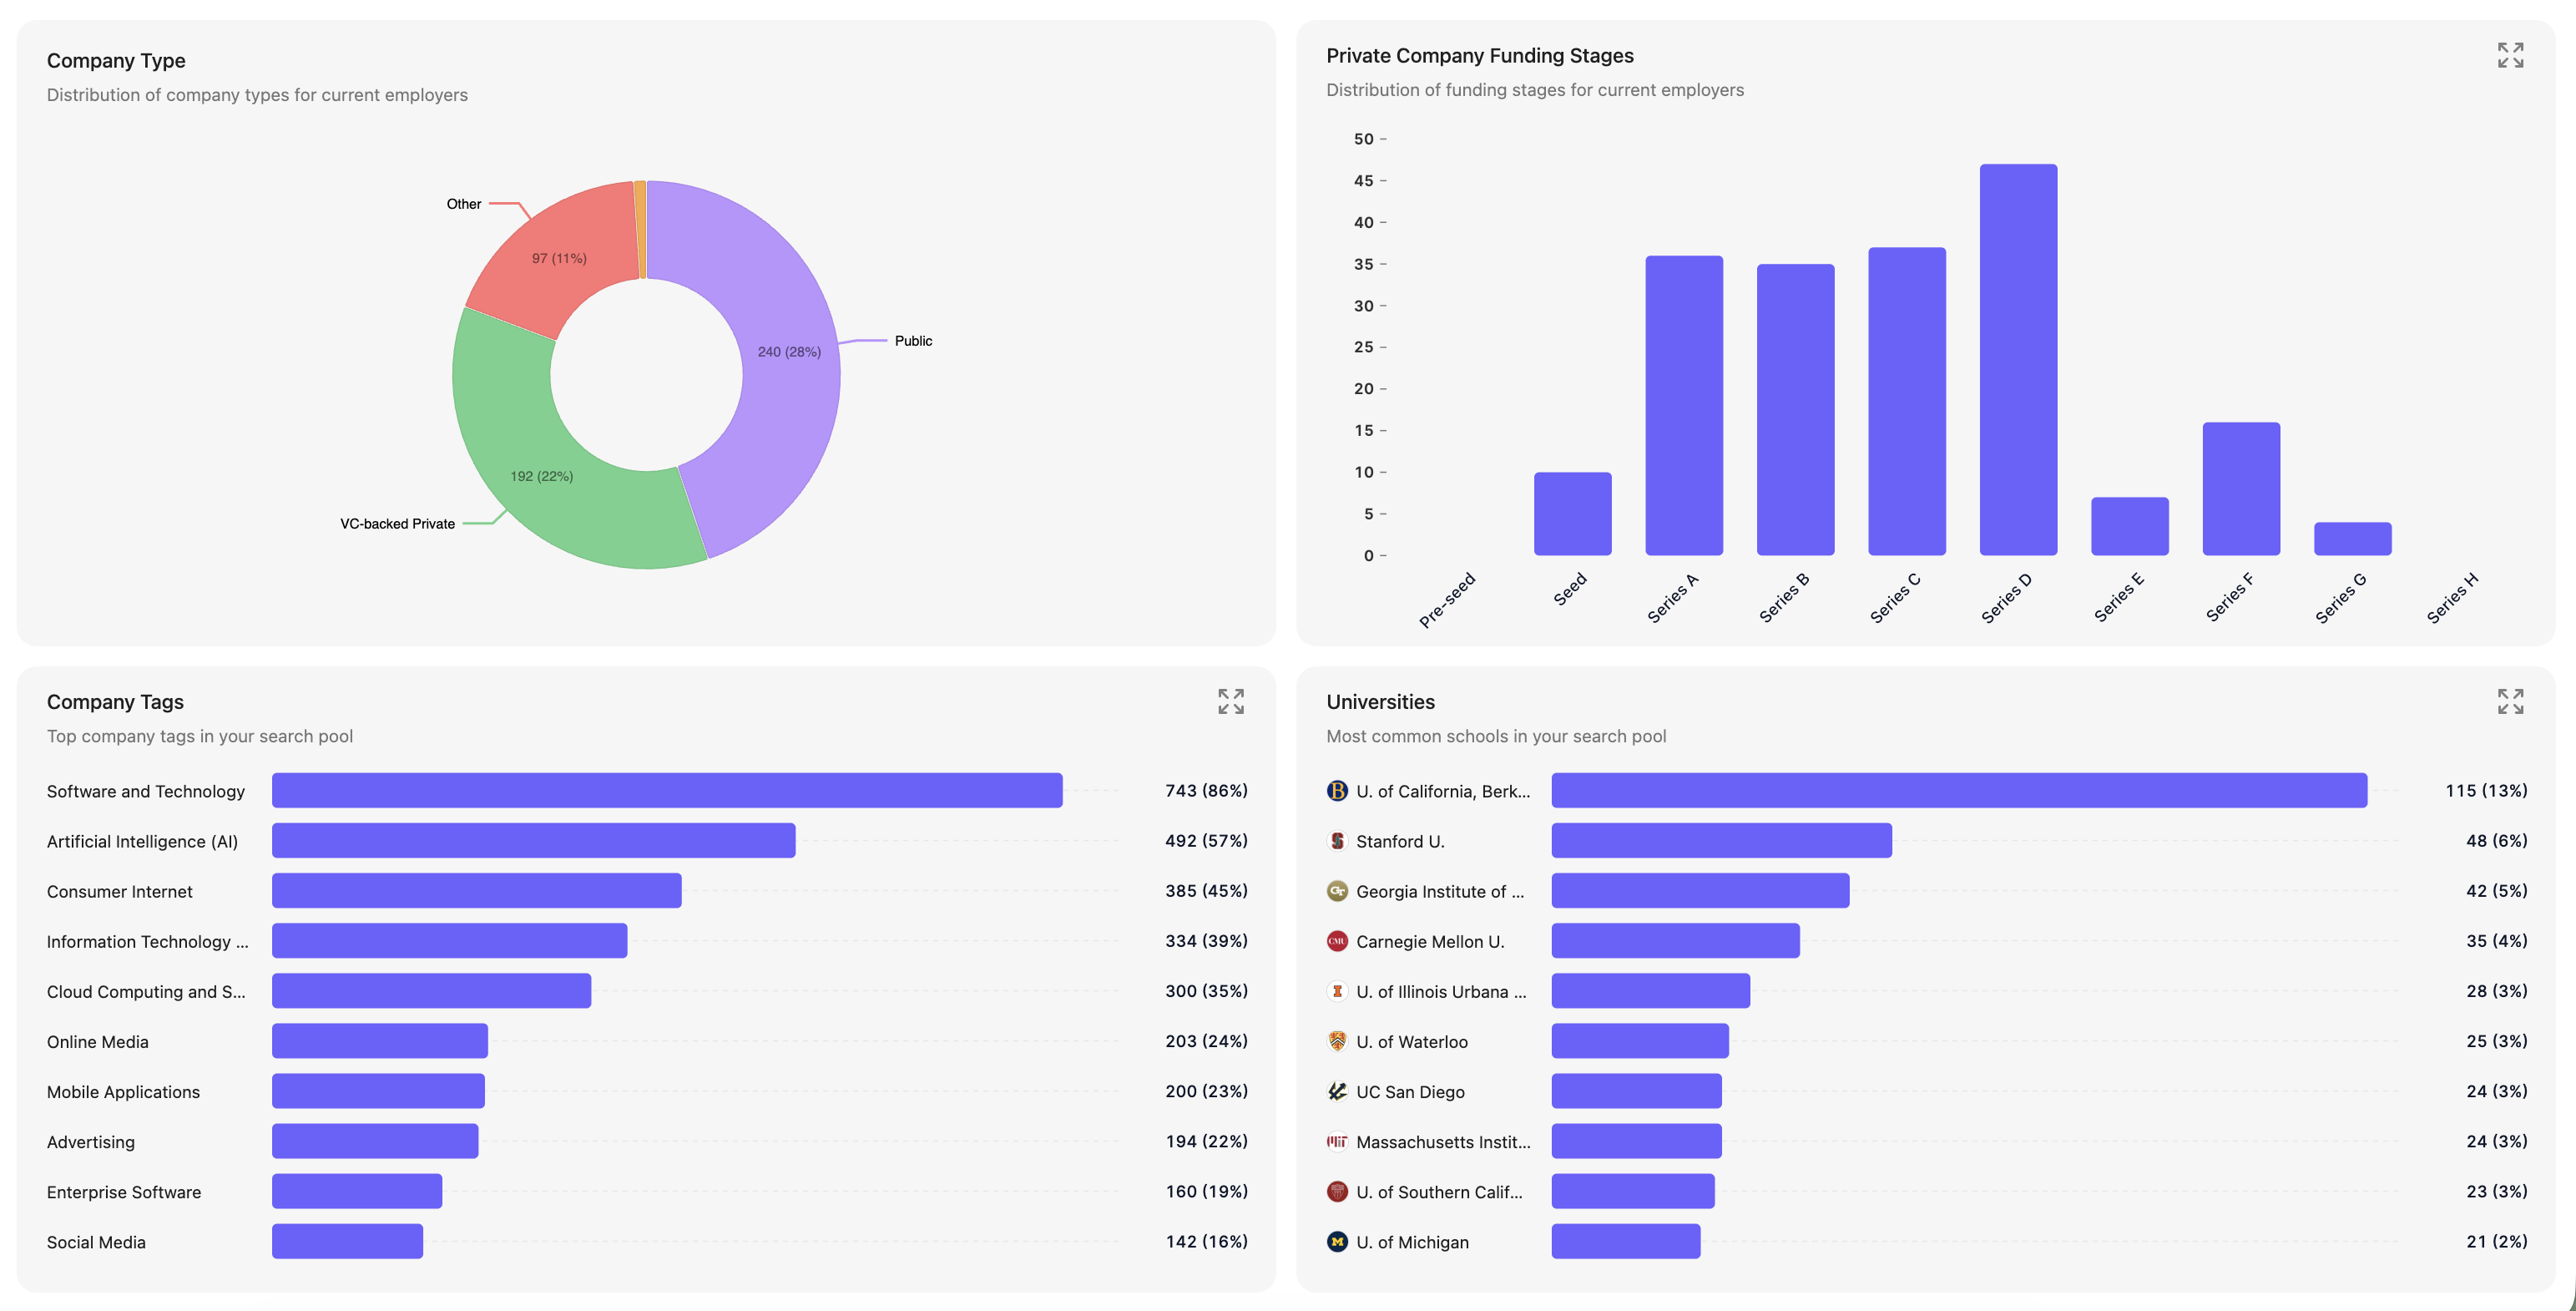
Drill down into the specific company types, funding stages, and universities tied to your talent.- Company Type: The breakdown of your talent’s current employer type, e.g., public, private, or VC backed.
- Funding Stages: The distribution of funding stage experience across your talent pool.
- Company Tags: The top company tags across your search pool.
- Universities: The top universities attended by your talent pool. Please note, if an individual attended more than one university, both may be shown.
Degree Level, Majors and Languages
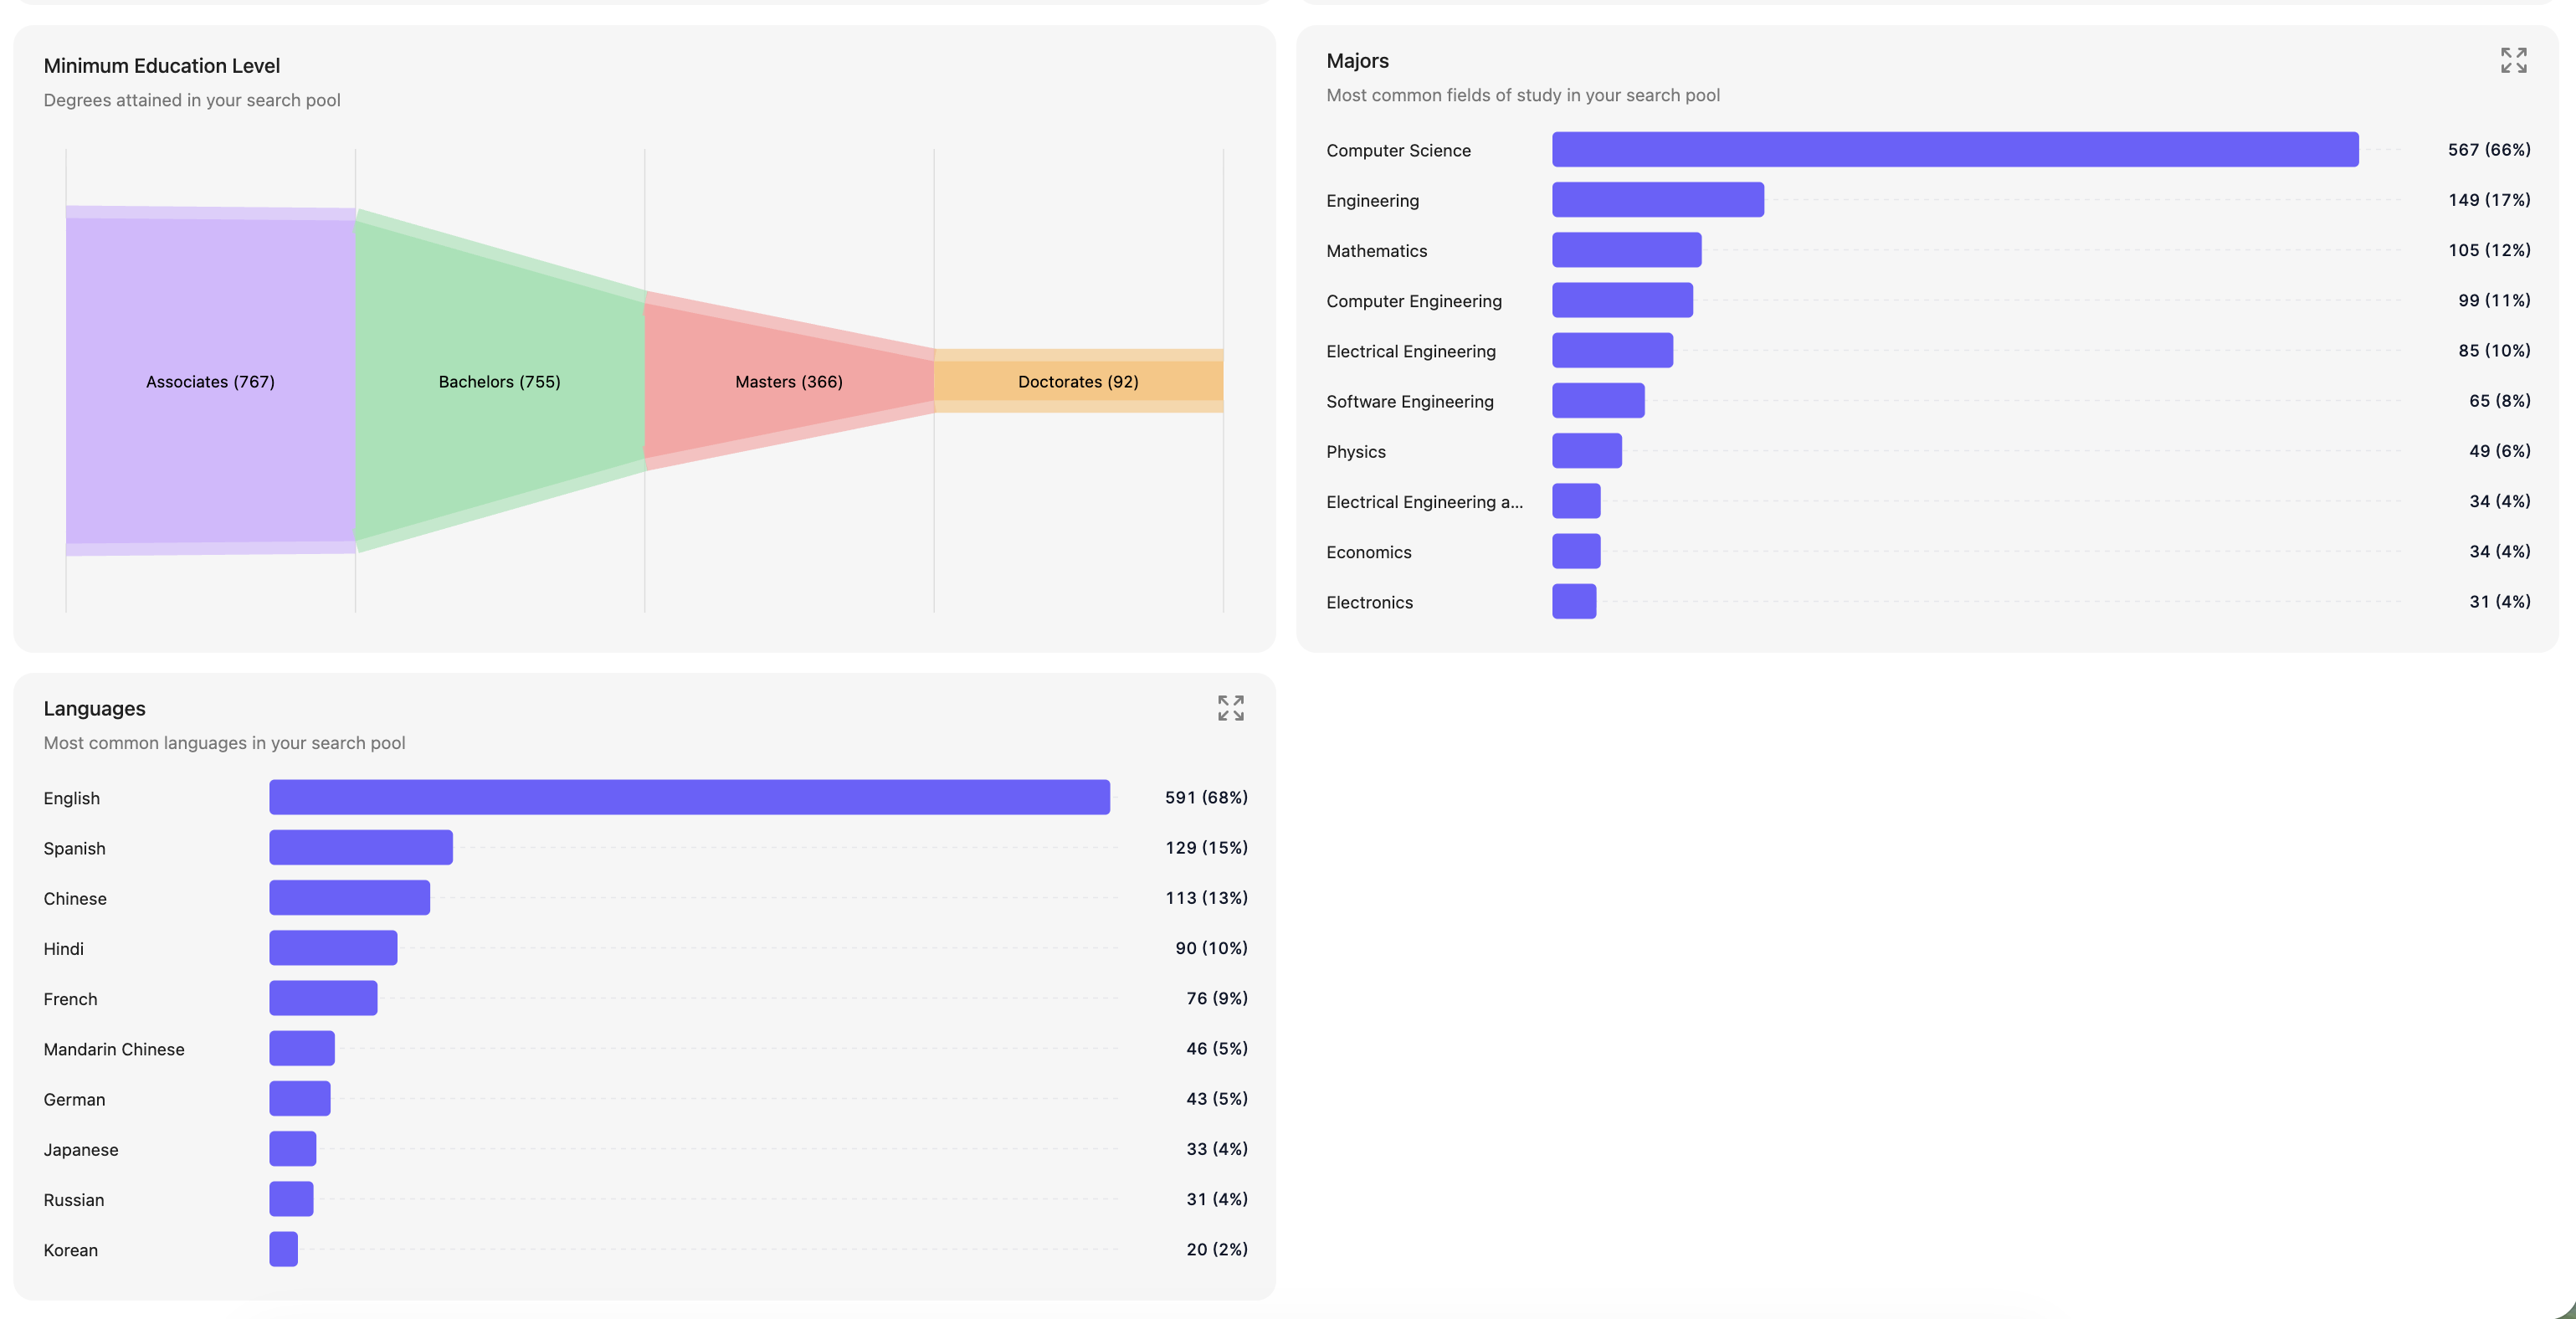
Identify the minimum education levels, majors and languages spoken across your talent pool.- Minimum Education Level: The degrees attained across your search pool.
- Majors: The fields of study completed by your talent. Please note, this may include multiple fields of study per profile.
- Languages: The most commonly spoken languages across your search pool.
Refining your Search Results
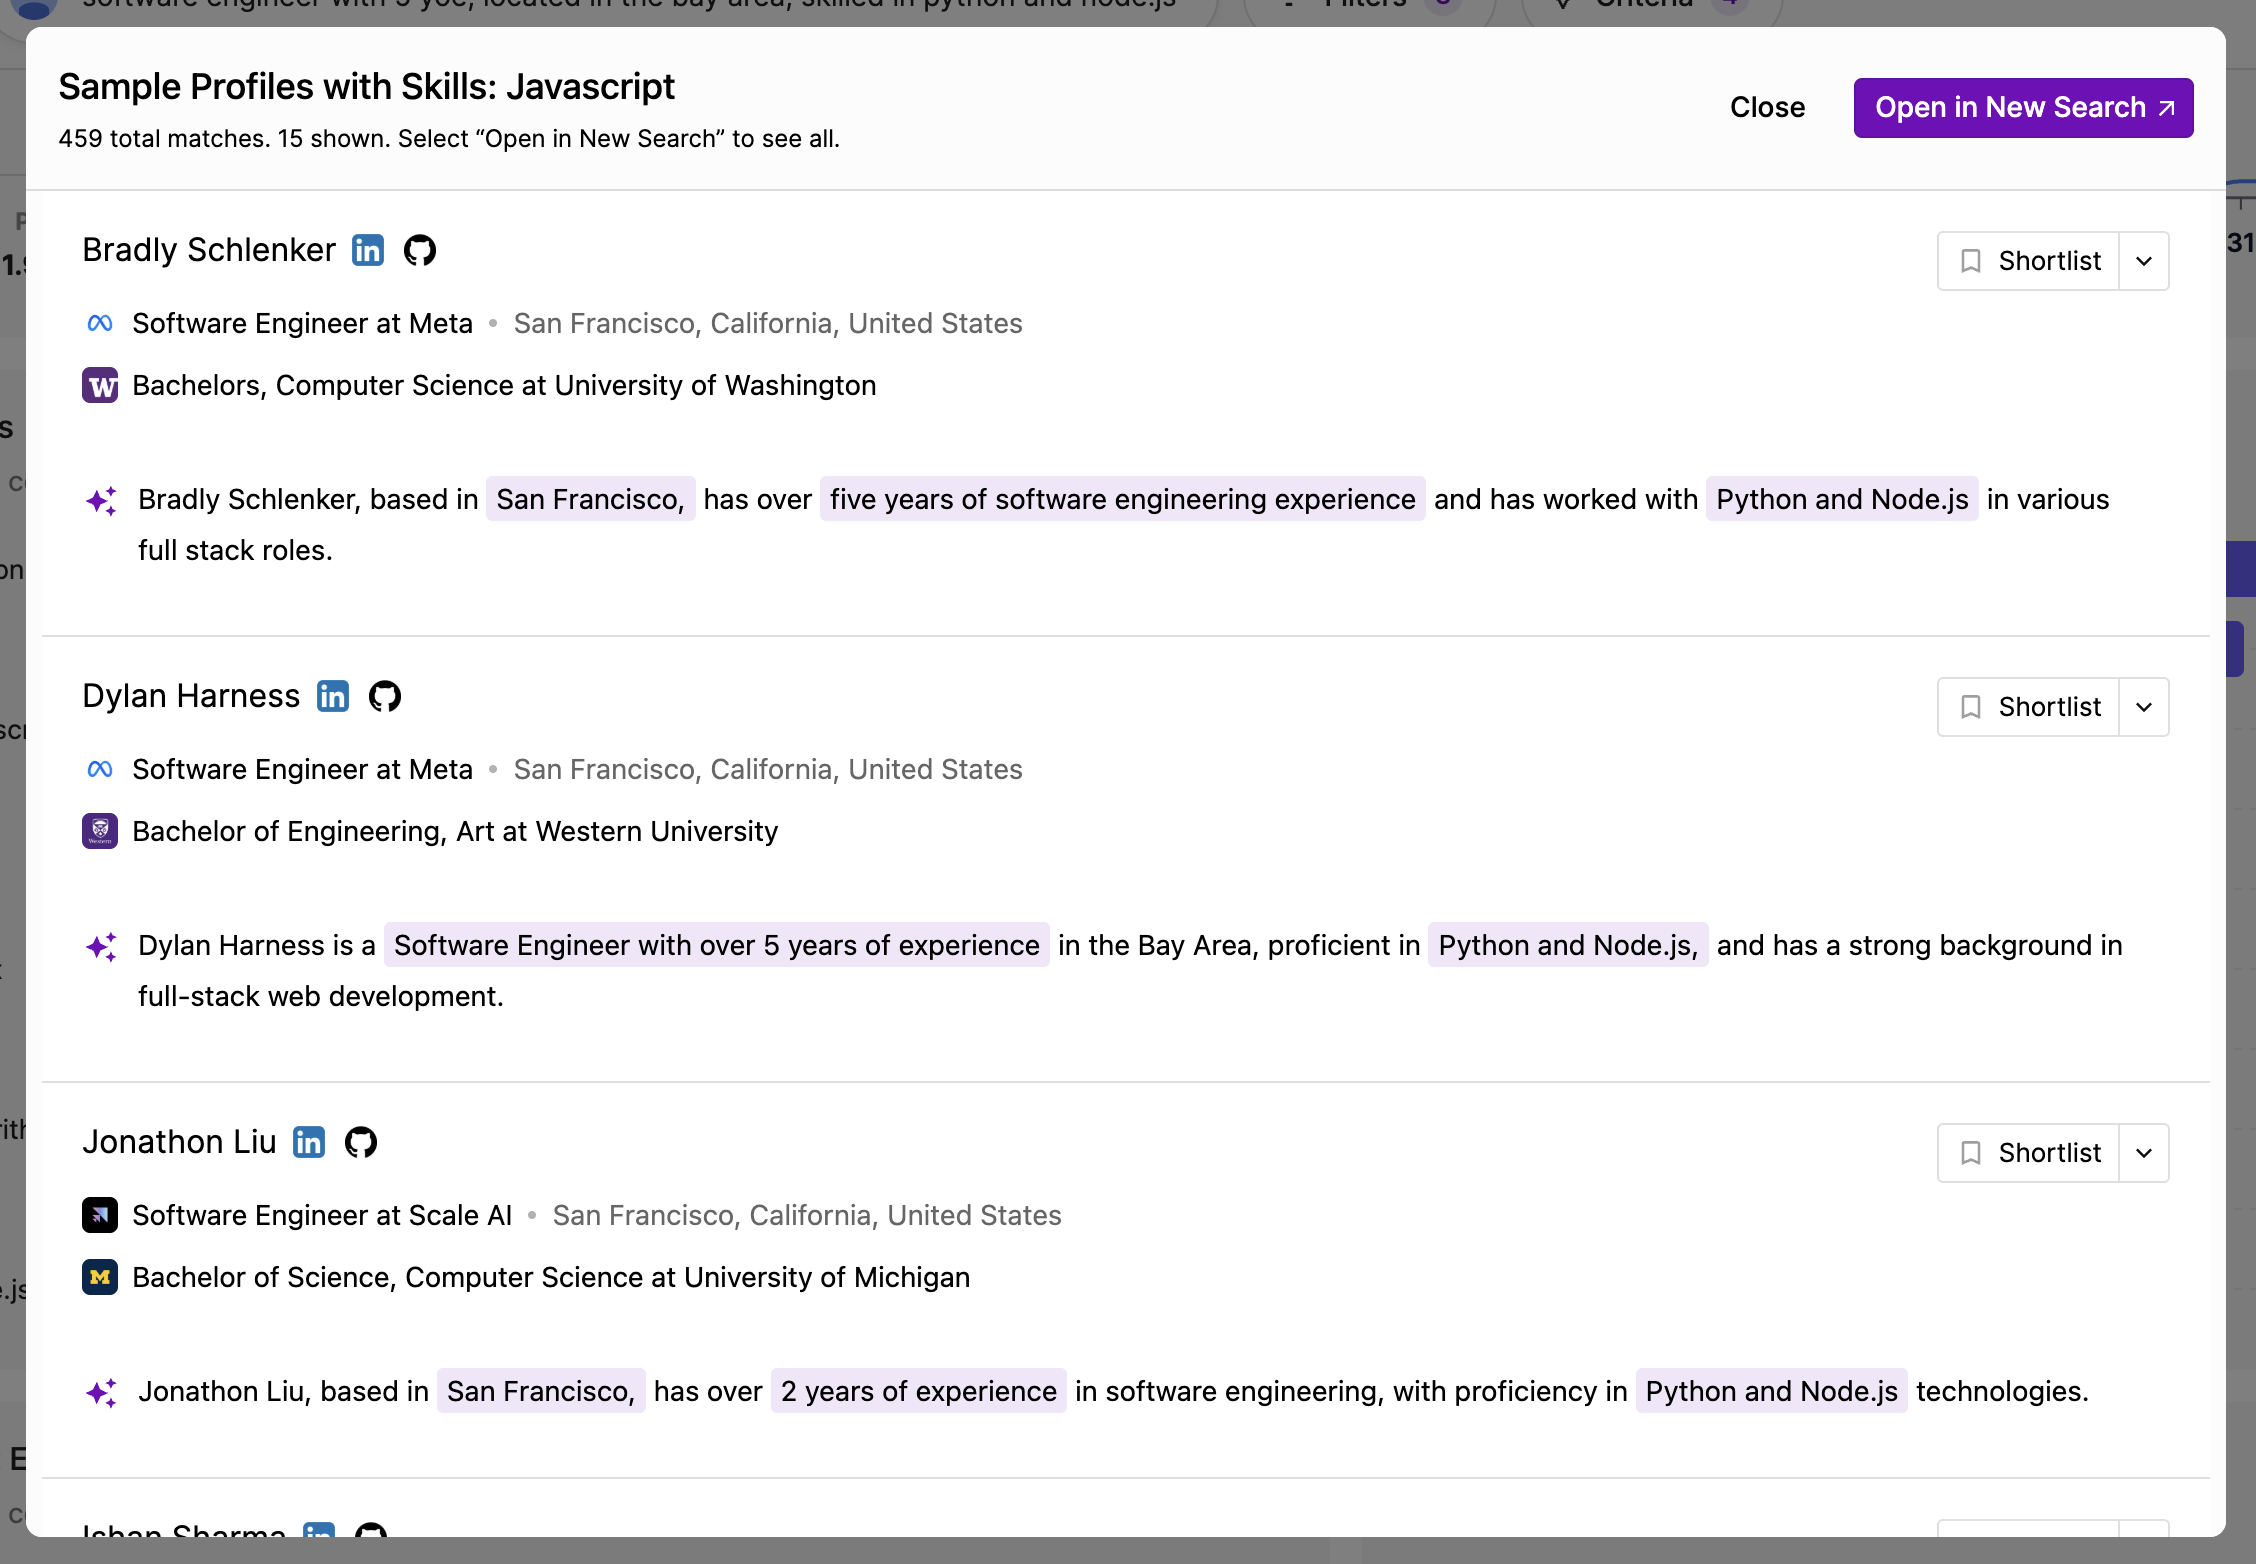
All reports are fully interactive, allowing you to click into any metric to explore further. Selecting a metric will reveal sample profiles that match the criteria and give you the option to start a new search based on that data point.- Sample Profiles: The pop-up will show up to 15 initial results for your refined search. You can see the total number of matches in the top left of this pop up. For example, in the picture below, there are 459 total matches, but only 15 shown for candidates with the Javascript skill.
- Open a New Search: To view all profiles that match your criteria, select “Open in New Search” to create a new search with the selected filters pre-configured. You will also be able to run another insights report on top of your new search to see that talent pool breakdown as well.
Exporting your Insights Report
To share your Insights report with a Hiring Manager, client or another teammate, please select Export Insights in the top right corner of your Insight page. This will initiate a PDF download that you can share across teams, departments or clients.